GraphQL
The Performance Problem That Isn't in Your Latency Dashboard
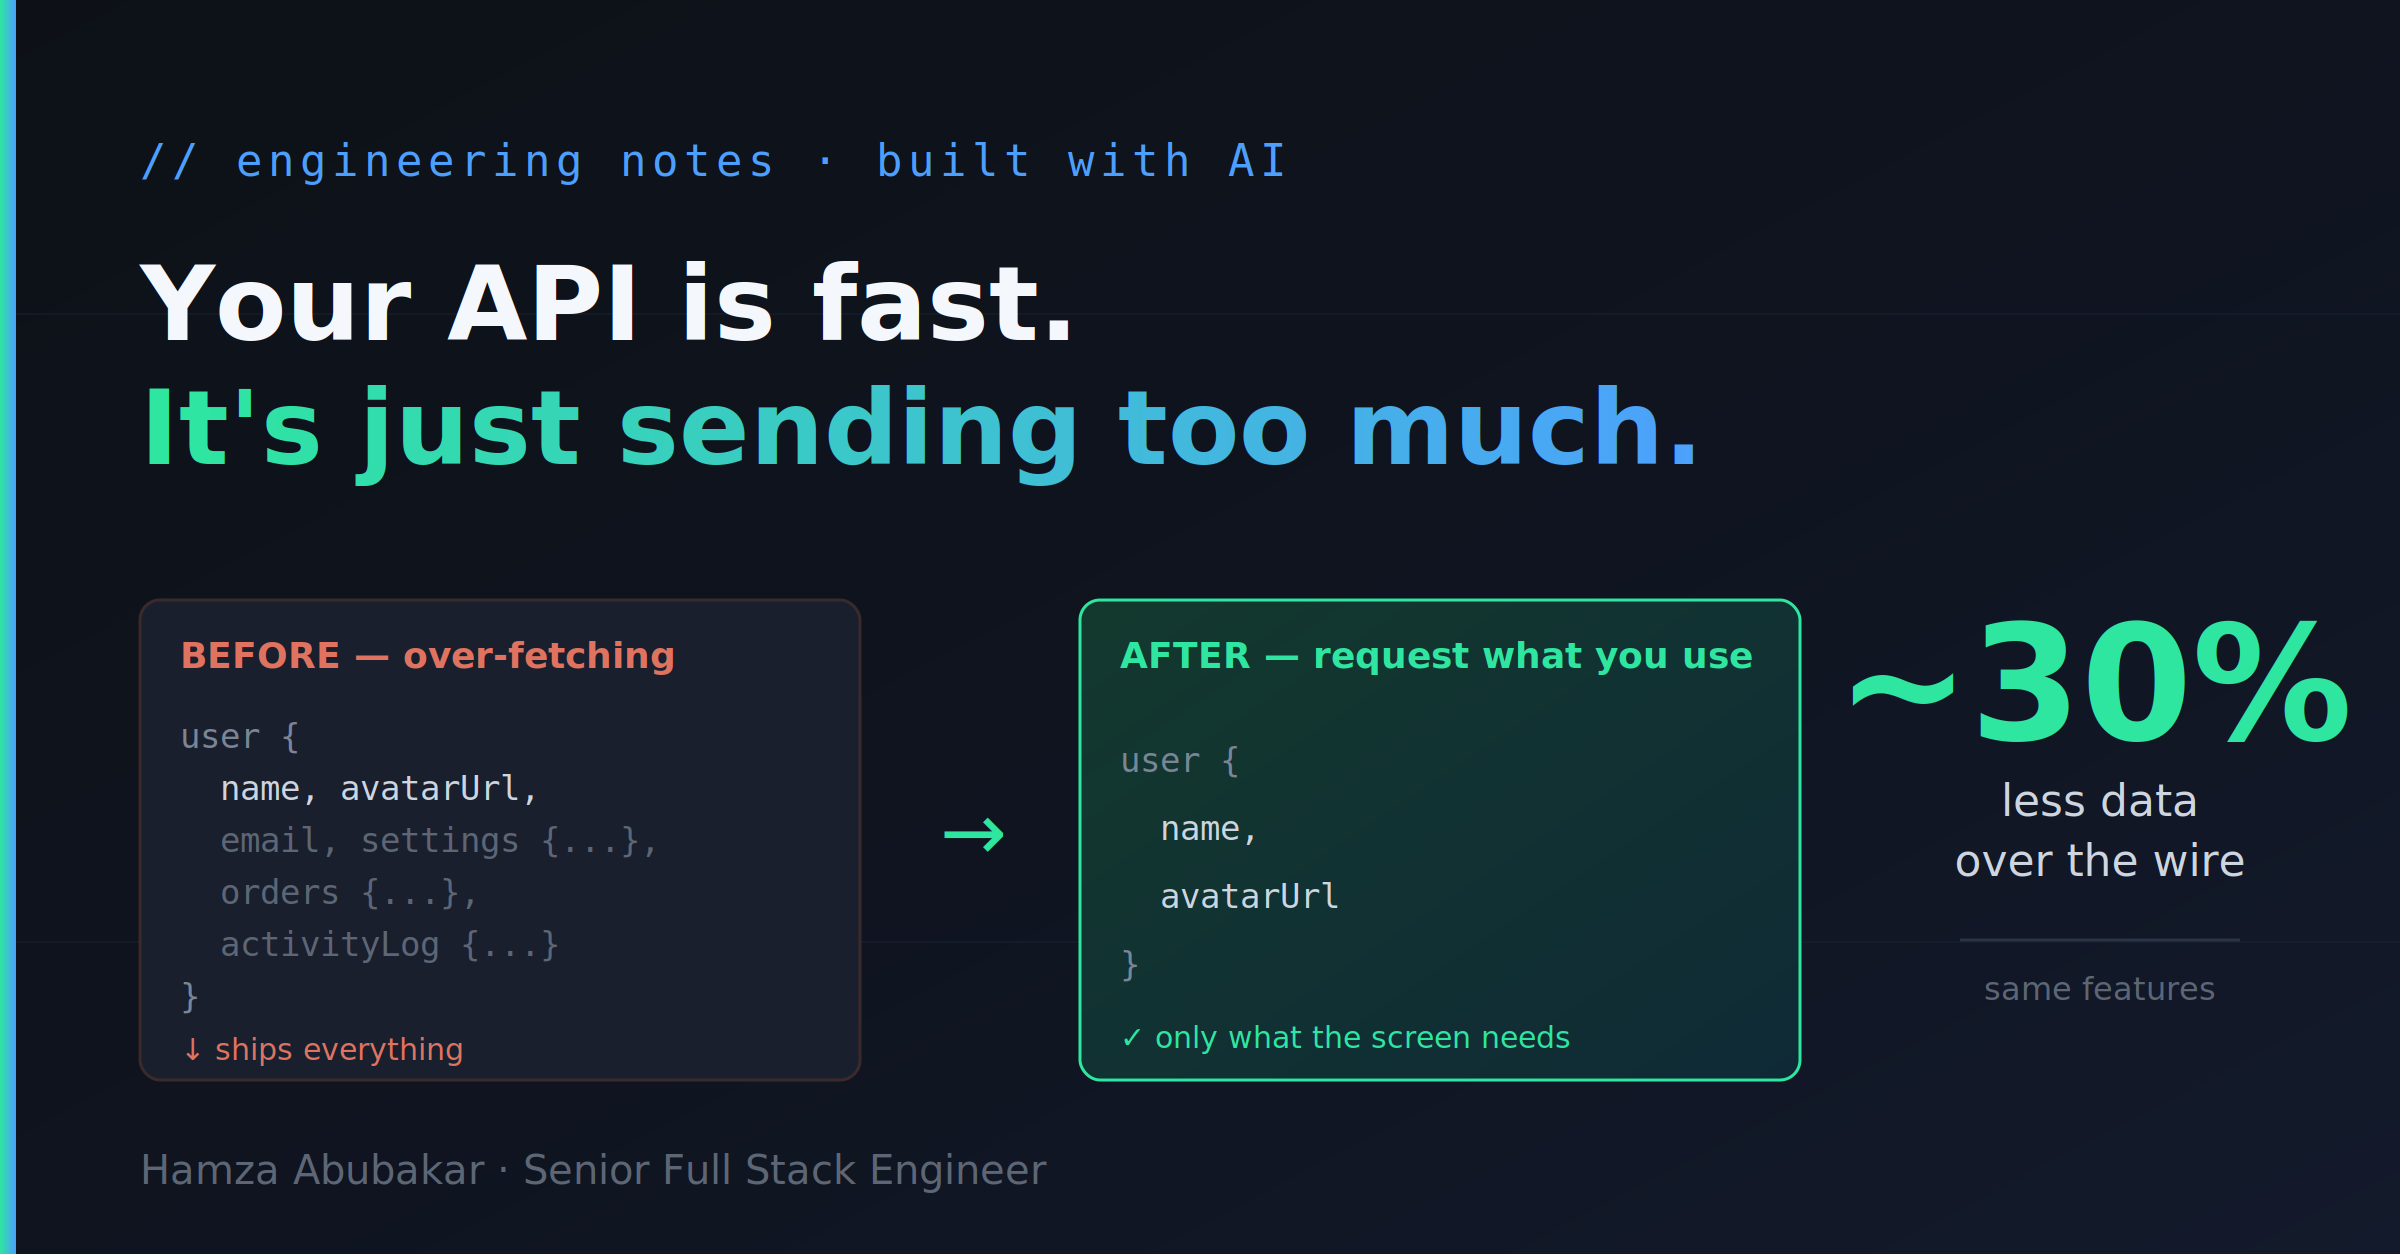
Our application looked healthy. Every endpoint sat comfortably under our latency budget. The dashboard was green. And yet, on real devices and real connections, screens felt sluggish.
The problem wasn't how fast each request was. It was how much each request carried.
What over-fetching actually is:
Over-fetching is when an API returns more data than the client needs. A component that renders a user's name and avatar doesn't need their settings, their order history, or three levels of nested relations — but if the endpoint returns the whole object, that's exactly what ships over the wire.
The insidious part: it never shows up in response-time monitoring. Each endpoint is individually fast. The cost is hidden — it lives in payload size, client-side parsing, wasted bandwidth, and a degraded experience for anyone not on a fast connection.
A concrete example
Here's the kind of query that looks fine but quietly pulls everything:
If the screen only renders the name and avatar, everything below avatarUrl is waste. Now imagine this pattern repeated across dozens of components.
The fix is to request only what the screen renders:
Trivial in isolation. Across an entire app, the aggregate difference is large.
Where AI actually helped
The hardest part of fixing over-fetching isn't the fix — it's finding it. You have to trace every component back to the query feeding it and figure out which fields are actually consumed. Across a large codebase, that's hours of tedious manual cross-referencing.
This is where I leaned on Claude Code and Codex. I had them:
- Map field usage — scan components and report which fields each one actually reads versus what the query requests. This surfaced the over-fetching hotspots fast.
- Draft the slimmed-down queries and fragments based on that mapping, so I wasn't rewriting dozens of queries by hand.
- Flag N+1 risks in resolvers where a single query quietly fans out into many database calls.
What would have been a multi-day manual audit became a guided one. But the tools didn't make the architectural decisions — I did. Every AI-suggested change got read, sanity-checked, and often corrected before it shipped. AI was the researcher and the typist. The judgment stayed mine.
The three things that actually moved the number
1. Designed around the screen, not the resource. Instead of "here's the user object, take what you want," I shaped queries around what each view displays. Reusable fragments let components declare their own data needs explicitly.
2. Enforced field selection. Clients ask for specific fields rather than defaulting to the full object. This pushes the "what do I need" decision to the place that knows — the component rendering it.
3. Killed the N+1 traps. A single query that looks cheap can fan out into dozens of database calls when resolvers fetch related records one row at a time. Batching those lookups collapsed the hidden query explosion that made some "small" requests expensive.
The result
Roughly 30% less data transferred for the same features. Lighter payloads, less client-side parsing, and noticeably snappier screens — the improvement was most visible exactly where it mattered most: mobile users on slower networks.
The takeaway
A fast endpoint that returns data nobody uses is still slow where it counts — at the screen. Latency dashboards measure how quickly you send a response, not whether that response was bloated.
And on the AI side: the win wasn't that AI wrote my code. It's that AI did the tedious archaeology — tracing field usage across the codebase — so I could spend my time on the decisions that actually required judgment. That's the pattern worth repeating.